Objects in GUI
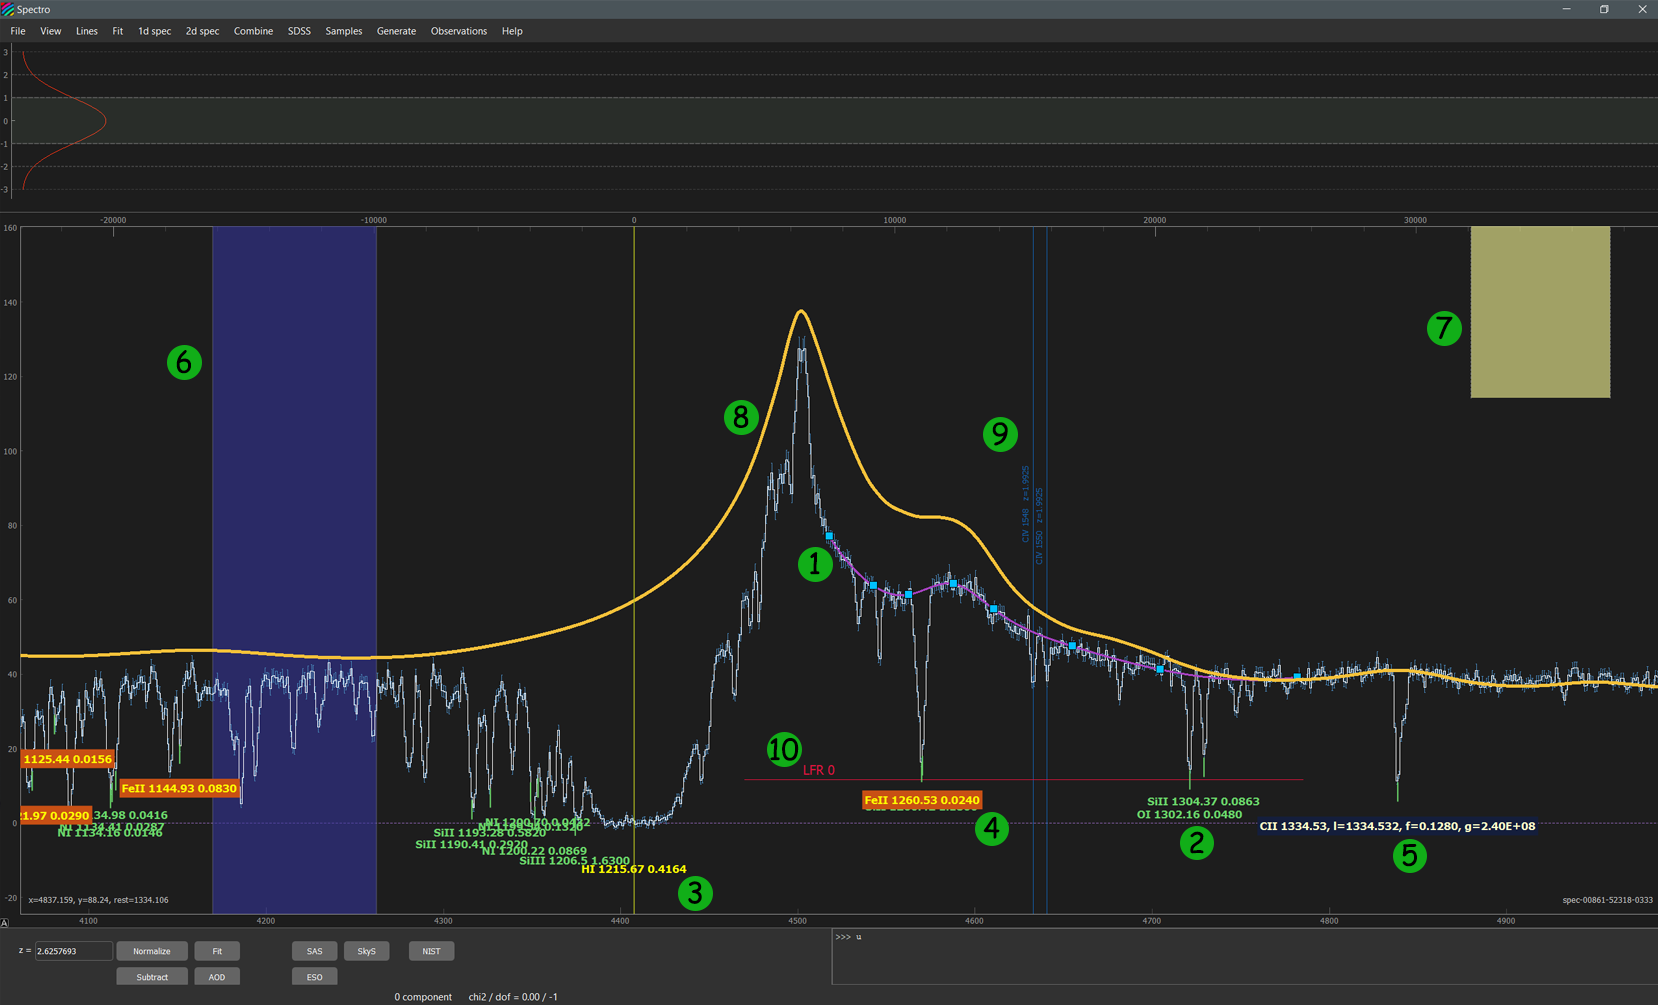
There are several interactive objects in the sviewer that can be move by mouse interaction to alleviate and speed up the spectral analysis. This objects are shown in this Figure and their description is given below
B-spline continuum
The continuum that is constructed using B-spline with the point chosen by holding b key (see Tutorial and Keyboard). It is marked as object 1 on the Figure.
Line labels
Line labels (objects 2, 3, 4, 5 in Figure) indicate possible positions of the absorption/emission lines corresponding to atomic/molacular transitions. The vertical position of the line label is tight to the spectrum, while the horizontal position can be changed either by moving line labels (using drag by mouse and keyboard) or by setting appropriate redshift in the redshift field in the Control panel. One can add/remove line labels using Console commands: show <species> and hide <species>. There are useful representations and interaction actions with line labels that ease the spectral analysis:
SHIFT + DRAG: move the line label by changing its redshift.LEFT ARROWandRIGHT ARROW: move the line label by changing its redshift.SHIFT + LEFT ARROWandSHIFT + RIGHT ARROW: move with wider step.SHIFT + LEFT CLICK: set line label as a reference line (see object 3), the top axis will be scaled with velocity offset from this line.CRTL + LEFT CLICK: delete line label.h + LEFT CLICK: highlight all line labels of the species (including level) that correspond to this line, similar to writing in the Console:high <species>. Highlighed line label is marked by object 4.ALT + LEFT CLICK: show extended information about this line (see object 5).K + LEFT CLICK: add line to the current (highlighted) group of fixed absorption lines.
Regions
Regions (objects 6 and 7 in Figure) are convenient graphical object to select certain wavelength range of the spectrum. It can be used in several parts of the spectral analysis. There are two representation of the regions in extended (object 6) and minimized (object 7) form. Allowed interactions:
r + LEFT MOUSE BUTTON: create a region.DOUBLE LEFT CLICKon region: switch between extended and minimize representation.SHIFT + LEFT MOUSE BUTTON: modify (shift and changing size) the regionr + RIGHT MOUSE BUTTON: delete region that is clicked.CTRL + LEFT CLICK: delete region that is clicked.
Composite spectrum
Composite spectrum (object 8 in Figure) indicate a composite spectrum of QSO or Galaxy one. Currently, there are 3 types of the composite spectrum that is shown one after another. The spectrum will be displayed taking into account the redshift provided in the redshift panel. Interactions:
CTRL + q: show/hide composite spectrum. There are different types, which are shown consequently.CTRL + g: show/hide galaxy spectrum. There are different types, which are shown consequently.SHIFT + DRAG: drag composite spectrum, during this its normalization and redshift is changed.ALT + DRAG (vertically): apply extinction to composite spectrum. The quantity of Av is scaled with vertical shift of the cursor.CTRL + LEFT CLICK: hide composite spectrum.
Fixed Line Labels
Fixed Line Labels (object 9 in Figure) are separate (from objects 2-5) line labels to mark the absorption lines with fixed position, i.e. those positions (i.e. redshifts) do not change with changing of the main redshift in the redshift panel. Usage of this line labels is a convenient way to mark nuisance absorption lines seen in the spectrum (mostly several doublets that ). These lines are usually combined in the groups that allow to add/exclude certain line. Interactions:
u + LEFT MOUSE BUTTON: creat line group.DOUBLE LEFT CLICKon text label: highlight doublet.SHIFT + LEFT MOUSE BUTTONon text label: shift (change the redshift).ALT + LEFT CLICKon text label: delete line from the group.CTRL + LEFT CLICKon text label: delete line group.
Line flux residuals (zero levels)
Line flux residual (object 10 in Figure) is the indicator of zero level, that can be a part of the fit profile construction, to model the partial coverage. Interactions:
p + LEFT CLICK: create line flux residual object.SHIFT + LEFT MOUSE BUTTONon text label: shift.CTRL + LEFT MOUSE BUTTONon text label: delete.